Steam: Starship Traders MMO Steam Page
Discord: Starship Traders MMO Discord
January 15, 2024: Discord notes:Click the link above to join our discord server and receive a notification when we launch a new, permanent realm. Since this game requires a certain minimum of players for a viable realm, we will only launch the permanent realms when we have enough players to populate them. We intend to launch three realms. One realm will serve the Americas, a second will serve Europe, and the third will serve Asia. Current plans are for the American realm to be located in New York, the European realm in Frankfurt, and the Asian realm in either Bangalore or Singapore, depending on interest.
A short overview of Starship Traders MMO
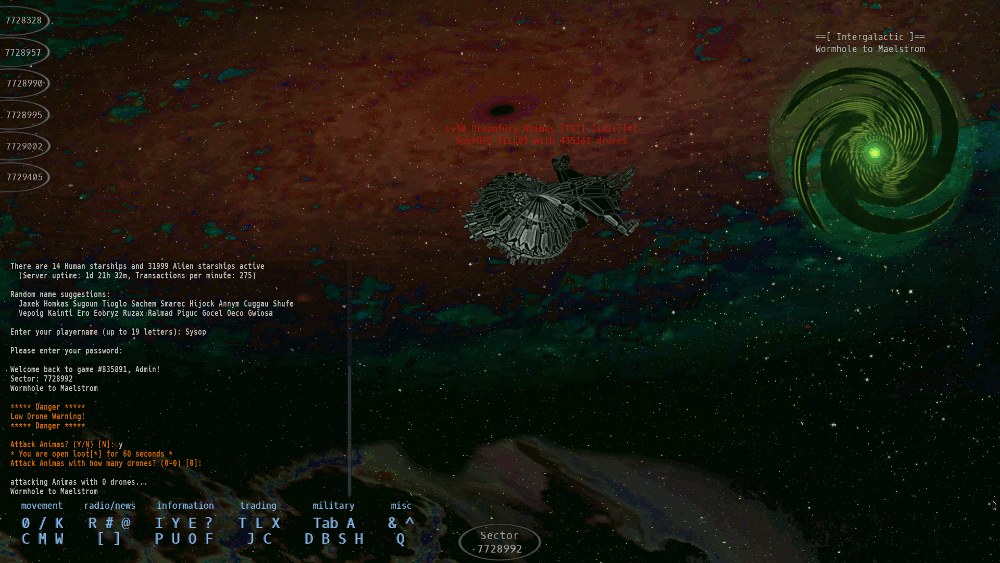
Starship Traders MMO plays like a cross between a modern MMO and a graphical version of a traditional MUD (Multi User Dungeon). The main MUD-like characteristic is the perspective of the player. Each location in the game is a 'sector'. You can only directly see the objects, players, and aliens within your current sector. As a new player, you'll start in a random sector of the same galactic core as all other new players. You'll be equipped with a minimalist space ship that gives you the ability to scan nearby sectors for other ships. Your ship's autopilot will plot flight paths to any detected ships as well as other nearby planets and ports that you may also scan for.
You wound up here in this unexplored region of space by following the beacon of the scout ship, 'Raven'. Raven beamed a deceitful tale of a lovely Earth-like planet ready for human habitation, luring many to abandon the overcrowded Earth in hopes for a better life. The details of this story are told by Trading Post mechanics as part of a mission (quest). As a stranded space ship pilot, your first goal is to learn to survive in your new environment, by first trading among the ports and planets and later hunting aliens for cash and ship upgrades.
Players can create corporations or apply to join an existing one. Corpmates can share defensive resources and pool their power to monopolize a valuable star cluster. Wormholes to star clusters can sometimes be guarded to gain exclusive control of a slice of space.
The MMO requires a keyboard to play -- and is optimized for efficient play by keyboard. It does have mouse support, but like many MMO's, typing is faster than pointing and clicking.
The Good and Bad of Starship Traders MMO
tl;dr: Great MMO gameplay, minimalist visual interface
As for The Good, SSTMMO has:
- Truly a one-of-a-kind game, it was slowly evolved from Starship Traders inspiration.
- unique gameplay that slowly emerges as you learn the game,
- great music that is not intrusive,
- a minimalist GUI, optimized for keyboard play; if you're a fast typist, you'll quickly adapt.
- a resource-based combat system. Kills are not free so you must choose your battles with a goal of benefiting from each fight.
- The PVP system discourages killing innocent lowbies. You will be flagged temporarily as 'open loot'. In addition, your ship remains visible when you log off and stealth effects stop working for the duration of the flag. Further accumulation of negative honor can even flag you indefinitely. (Drones carried with your ship still automatically defend you if attacked while offline, just as online.)
- With that said, You *can* play as an outlaw, if you're clever, courageous, choose your battles carefully, and hide well.
- It has an excellent character name generator. (this may be useful to you even if you have no interest in the MMO)
- The SSTMMO universe is a unique environment and each galaxy has its own structure.
...and then there's The Bad:
- SSTMMO being a unique game means that you do not know how to play at all! This game is new to almost everyone.
- It has no pre-planned experience to train new players. Just hints and a few short tutorials on the basics.
- It has no 'skill-based' combat. Combat is routine, predictable, and, as Sun Tzu wrote, battles are won (or lost) before the combat even begins.
- Its minimalist GUI is not entirely a good thing. It is not consistent with most modern MMO's, so it won't feel familiar.
- The players are visible only by their ships; Your ship *is* your avatar. This is not exactly a problem, but will be unfamiliar to most.
- This is an MMO designed and developed by a solo developer. The game itself was designed from the beginning to fit within the constraints of solo development so lavish art and voice acting, among other things, are not a part of the game. (On the upside, you won't have to endure bad voice acting!)
A true Sandbox; You can change, create, destroy, move, or guard anything.
Large galaxies to play and hide in, with an autopilot for navigation.
Combat consumes expendable resources; there are no free kills.
Player housing is secure, shareable, moveable, and in the open world.
Regional realms (Europe, Asia) to be added in the future will be unique.
__News__
Starship Traders MMO is now available Free on Steam!
__Download Links__
Why Starship Traders is different from other MMO's
SST MMO Lore: The Tale of the Lost Raven
Screenshots, slightly outdated
A short gameplay video
The game Reference
__Software Instructions__
The clients are self-contained programs that require no installation.
To run the Linux version perform the following steps from a terminal window:
1) Uncompress the Linux PC program:
bunzip2 sstmmo.bz2
2) Make your program executable:
chmod +x sstmmo
3) Run your version: You can now use your GUI view to click on the program -- or you can run it directly from the terminal as in the examples below:
./sstmmo
(Note that you may see a few debugging messages upon exit when running from a terminal window. These messages refer to items used internal to the client and you can safely ignore them. The messages are only useful for developers.)
__sha256 file hashes__
Linux: Thu Apr 18 07:42:01 PM EDT 2024
ee6acf021580f4f882915de8a5637ebaf5a10d26387b2a23f4b4844de989f28f sstmmo
44177eb1d93d6608e2d2af92970a44c914573d7f13088040571a4c52906dd4de sstmmo.bz2
Windows: Thu Apr 18 07:42:02 PM EDT 2024
de9853073a9691555ddfbbda85d1ea18895ef03c462484d2fb6fb46a7cd8af4b sstmmo.exe
825b0e5bd58746aa3d6288c8b55b782d1064e80fe0f674a632f47dd475150597 sstmmo.exe.zip
|