Starship Traders MMO
SSTMMO, a sandbox game-world built by a single developer, (*re)Launches the first permanent realm cluster on September 27, 2025Starship Traders MMO "Maelstrom" realm cluster, based in New York, launches as a live permanent SST universe on Saturday, the 27th of September, 2025.(*)The prior launch had a critical bug which took days to track down and fix, interrupting the launch. Mistakes were made and a lesson was learned... But we're better prepared this time! Steam: Starship Traders MMO Steam Page Discord: Starship Traders MMO Discord
Discord notes:Click the link above to join our discord server and receive a notification when we launch new, permanent realms. Since this game requires a certain minimum of players for a viable realm cluster, we will only launch the permanent realms when we have enough players to populate them. We intend to launch three universe. One will serve the Americas, a second will serve Europe, and the third will serve Asia. The American realms to be located in New York, the European realms in Frankfurt, and the Asian realms in Singapore.
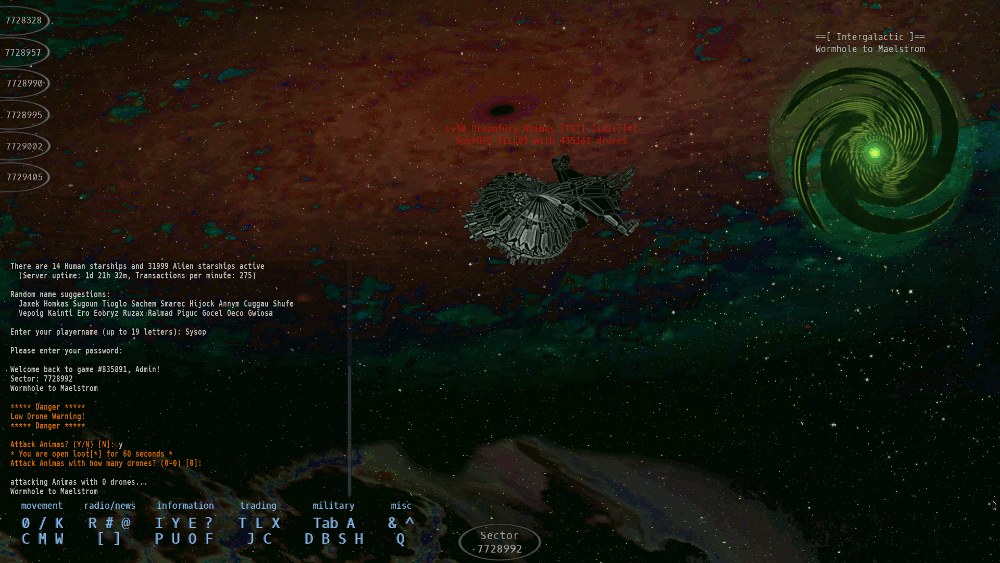
A tiny intro to the Starship Traders MMO UniverseStarship Traders MMO plays like a cross between a modern MMO and a graphical version of a traditional Multi User Dungeon. Each location in the game is a 'sector'. You can only directly see the objects, players, and aliens within your current sector. This structure makes it possible to guard small areas--and sometimes large areas--by fortifying a single sector.
The ScenarioAn exploratory intergalactic starship mission beamed back a tale of an unpopulated twin of Earth, prompting many would-be colonists to launch one-way trips to the new world. Unfortunately, all was not as it was presented... Now, as a stranded starship pilot, your first goal is to learn to survive in your new environment, first by scavenging the abandoned tradingposts, phishing for lost gear among the wormholes, hauling commodities between ports, and later by hunting aliens for cash and ship upgrades.Players can create corporations or apply to join an existing one. Corpmates can share defensive resources and pool their power to monopolize a valuable star cluster. Wormholes to star clusters can sometimes be guarded to gain exclusive control of a slice of space. The MMO requires a keyboard to play -- and is optimized for efficient play by typing. It has mouse support, but like many MMO's, typing is still faster than pointing and clicking.
Starhip Traders MMO (SSTMMO) is an original and unique game
The downside of being a unique game is that it will be completely new to you and you definitely will not know how to play! Learning the basics will take a little time and practice. It has no pre-planned experience or 'boot camp'. There are hints and short tutorials on the core topics, but, at first, you'll feel like you've been thrown into an alien environment.
__Download Links__Linux version (~105MB)
|